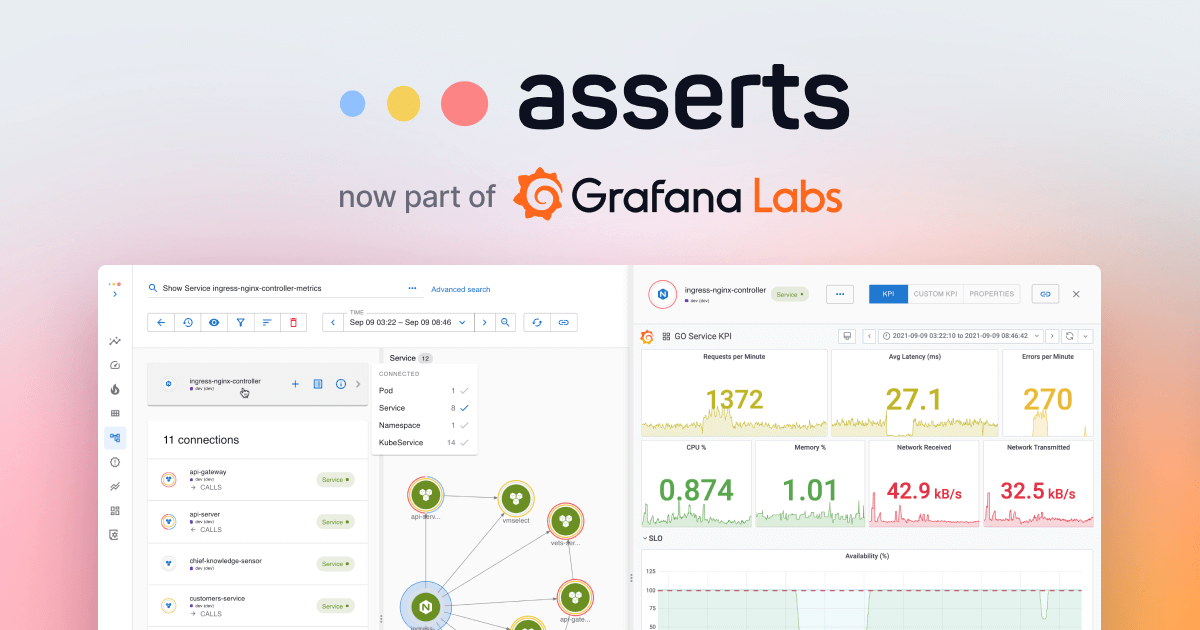
How Asserts.ai will make it even easier for Grafana Cloud users to understand their observability data

This blog was originally published on the Grafana Labs blog.

At Grafana Labs, our mission has always been to help our users and customers understand the behavior of their applications and services. Over the past two years, the biggest needs we’ve heard from our customers have been to make it easier to understand their observability data, to extend observability into the application layer, and to get deeper, contextualized analytics.
To that end, I’m excited to share that Grafana Labs has acquired Asserts.ai, a startup built to provide an easier way of exploring your telemetry and derive new insights for more efficient root cause analysis and faster issue resolution. The Asserts acquisition and the general availability of the Application Observability solution in our fully managed Grafana Cloud offering — both announced at ObservabilityCON in London today — are big steps toward meeting those customer needs and offering an easier-to-use, integrated, and opinionated user experience.
Asserts serves as a contextual layer for Prometheus metrics and provides out-of-the-box insights into the relationships among various system components over time (for example, what application is running in which pod, node, namespace, etc.) to enable users to better understand and navigate their applications and infrastructure. This layer is also used to build sophisticated, easy-to-use experiences for troubleshooting alerts, querying data, and automatic baselining.
At Heka.ai, “Asserts helps us quickly correlate problems in the cluster and surfaces previously unknown, lingering issues,” says Gabriel Creti, Engineering Manager and Technical Lead. “Asserts also offloads toil from our operations teams. By providing pre-made alerting rules and dashboards, it streamlines the painful job of maintaining them. It has always been a plus that the Asserts UI embeds directly into Grafana. We are excited to see it become a native part of the LGTM (Loki, Grafana, Tempo, Mimir) Stack going forward.”
Asserts.ai was founded in 2020 by Manoj Acharya, who was the fifth engineer hired at AppDynamics to build that product from the ground up. As Manoj tells it, joining forces with Grafana Labs seemed destined, as our paths had crossed in meaningful ways over the years. “I’d go to Monitorama every year. I watched Torkel [Ödegaard] launch Grafana and heard the team talk about Loki, Prometheus, and everything else,” he says.
At Monitorama in 2019, Manoj and I chatted over a round of beers, and he told me he was thinking about creating a unified data model for Prometheus metrics following the principles of the RED Method. Later that year, Manoj left AppD to start Asserts.ai, and began working on a metric meta model for the open observability data set – the SAAFE Model. “Joining Grafana Labs is super exciting because we’ve built on top of their open source projects, and now we can work with everyone directly and build a new world with Grafana and Asserts,” he says.
Indeed, we now have ambitious plans to leverage the SAAFE Model and the Asserts entity relationship graph database in Grafana Cloud, which will allow us to provide an easier experience to understand systems mapped into it, as well as visualize relationships among entities in those systems. We believe that these additions will accelerate our roadmap for truly unifying infrastructure and application observability in Grafana Cloud.
At ObservabilityCON, Manoj walked through an early demo of Asserts in Grafana Cloud, hot off the presses, which you can view here:
If you’re as excited as we are about this demo, you can register your interest in the private preview in this form, and we’ll be in touch when it opens to Grafana Cloud users. (And if you’re not already using Grafana Cloud, you can sign up for free here.) We’re looking forward to sharing with you all the capabilities our team is already busy building with Grafana and Asserts.

